Staying in the Green
Designed a core product feature to help admins and developers better track and manage their cloud costs
COMPANY
Cisco Cloud Platform & Solutions Group
TEAM
Kasturi Dani, Senior UX Designer & Kevin Kuo, Creative Director
TOOLS
Sketch, d3.js, rawgraphs.io, Principle
DURATION
6 months until 1st release
ROLE
Lead Designer
THE OPPORTUNITY
IT admins and developers struggle to keep track of cloud spend across services, frequently going over budget and asking for more funds from the Finance department.
THE OUTCOME
Established the end to end experience for cloud cost budgets, including budget creation, reports and notifications.
SKILLS
Wireframing
Interaction Design
Research: Interviewing & Think Alouds
Data Visualization Prototyping
COST OPTIMIZER
Cisco CloudCenter Suite is a hybrid multicloud management platform.
I was one of two designers working on Cost Optimizer, a module within the Suite that provided users with insights into how much they were spending on cloud services. I led the end-to-end design for a core feature, budgets.
It’s common for organizations to deploy their apps on all public cloud providers - AWS, Azure and Google Cloud, as well as their own private clouds.
There’s a need to have a one-stop shop where costs are aggregated, and IT departments can see all the cloud resources they’re using, including costs incurred.
Current solutions are difficult to use and it's not easy to get the information users are looking for.

IT Admin
Dave is in charge of setting up Cost Optimizer for the organization and manages company-wide resources and costs.

Engineering Lead
Deepika manages a team of developers and manages cloud spend within her team. She constantly needs to keep track of any unneeded cloud services in use, tracking spending and usually goes over budget. She writes scripts to clean up running but unused instances.

Developer
Dominic is a developer that just wants to get cracking with making apps. He'll spin up an AWS instance with little regard to the cost over time.

Finance Manager
Susannah sets the budget for departments in her organization, tracking costs at a high level for each department. She makes particular note of overspending as well as underspending departments, allocating funds accordingly.
BUDGET
REPORTS

Rows that should be reviewed are highlighted in orange (alert state) based on forecast, or red (over budget).
Expandable hierarchy allows the user to see a high level overview but also drill down to view subgroup details.
BULLET CHART

Summary visualization (also called a bullet chart) includes total forecasted cost for the budget period, alongside spend to date and budget allocated.
‘Today’ indicator: A marker indicating where the user is in the fiscal quarter/year to help provide context for budget utilization, and inform the urgency of action needed to be taken.
DASHBOARD WIDGETS

BUDGETS BY CLOUD, UNDERSPENDERS & OVERSPENDERS


BUDGET
CREATION


-
Department hierarchy is collapsible/expandable.
-
Users can easily navigate through the structure and allocate a budget to any node.
-
Reference information provided about historical cost per node as a reference for determining an appropriate budget amount.
-
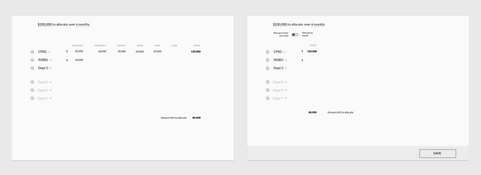
‘Smart’ allocation: auto-sums parent nodes to show if budget is allocated to a child node within; communicates status to the user if numbers don’t add up, or if there is an unallocated amount remaining.
PROCESS
BULLET CHART ITERATIONS

SKETCHES & WIREFRAMES


LOW FIDELITY MOCKUPS


